Pre-processing with QGIS#
Requirements
This tutorial is designed for beginners and before diving into this tutorial make sure to:
Follow the installation instructions for QGIS in this eBook.
Read (or watch) and understand this eBook’s QGIS Tutorial.
The first steps in numerical modeling of a river with BASEMENT consist in the conversion of a Digital Elevation Model (DEM) into a computational mesh. This tutorial guides through the creation of a QGIS project for converting a DEM (GeoTIFF) into a computational mesh that can be used with various numerical modeling software featured in this eBook. At the end of this tutorial, BASEMENT users will have generated a computational grid in the SMS 2dm format.
Platform compatibility
All software applications featured in this tutorial can be run on Linux, Windows, and macOS (in theory - not tested) platforms. Note that BASEMENT itself will not work on macOS platforms.
Recall: BASEMENT versions, BASEMD, and BASEHPC
BASEMENT version 2 (v2) was developed with complex structures and a broad range of capacities, yet little focus was drawn on computing time. BASEMENT version 3 (v3) considerably simplified the modeling process for users and came with highly efficient computing options, including massive parallelization on GPUs. However, the simplified v3 lacks many relevant modules, such as multi-layer riverbeds for calculating topographic change as a function of multi-grain size bedload transport formulae. Now, BASEMENT version 4 (v4) provides both the manifold capacities of v2 in the form of BASEMD setups, and the computing efficiency of v3 in the form of BASEHPC setups. This tutorial explains the setup of a BASEHPC model.
QGIS Setup#
Coordinate Reference System (CRS)#
Launch QGIS and create a new QGIS project to get started with this tutorial. As featured in the QGIS Tutorial, set up a coordinate reference system (CRS) for the project. This example uses data of a river in Bavaria (Germany zone 4), which requires the following CRS:
In the QGIS top menu go to Project > Properties.
Activate the CRS tab.
Enter
Germany_Zone_4and select the CRS shown in Fig. 70.Click Apply and OK.
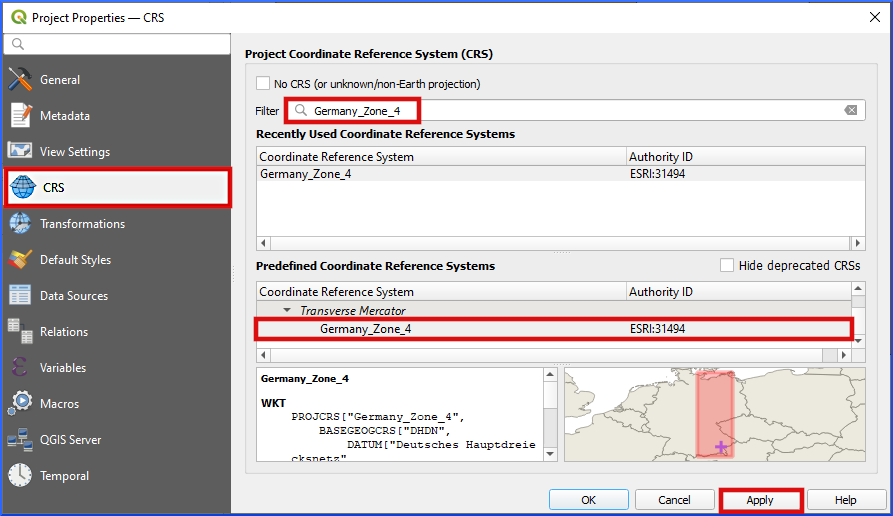
Fig. 70 Define Germany_Zone_4 as project CRS.#
Save the project…
Save the QGIS project (Project > Save As…), for example, under the name prepro-tutorial.qgz.
Get the BASEmesh Plugin#
Install BASEMENT’s BASEmesh Plugin (instructions from the BASEMENT System Manual):
Load the QGIS plugin manager: Plugins menu > Manage and Install Plugins.
Go to the Settings tab.
Scroll to the bottom (Plugin Repositories listbox in Fig. 71), click on Add….
In the popup window enter:
a name for the new repository, for instance,
BASEmesh Plugin Repositorythe repository address: https://people.ee.ethz.ch/~basement/qgis_plugins/qgis_plugins.xml
keep all other defaults.
Click OK. The new repository should now be visible in the Plugin Repositories listbox. If the connection is OK.
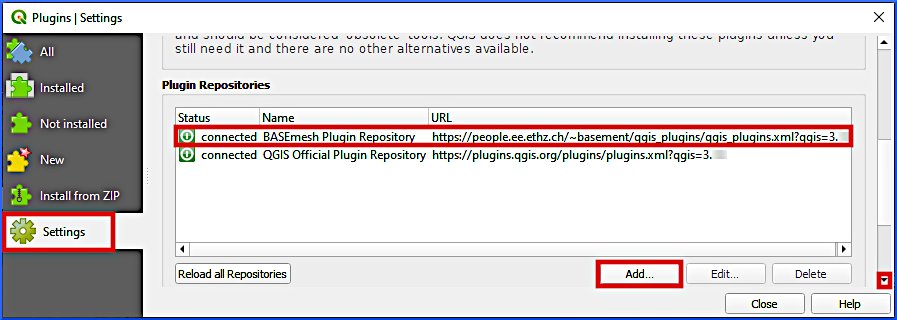
Fig. 71 Add the BASEMENT repository to QGIS’ Plugins Manager.#
Still in the Plugins popup window go back to the All tab an enter
basemeshin the search field.Find the newest BASEmesh (i.e., Available version >= 2.0.0) plugin and click on Install Plugin.
After the successful installation Close the Plugins popup window.
Verify that the BASEmesh 2 plugin is now available in the QGIS’ Plugins menu (see Fig. 72).
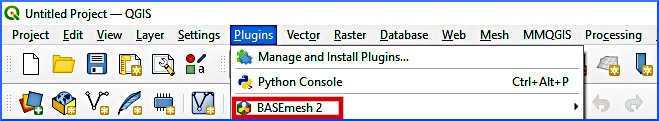
Fig. 72 The BASEmesh 2 plugin is available in QGIS’ Plugins menu after the successful installation.#
Load DEM#
This tutorial uses an application-ready DEM in GeoTIFF Gridded Cell (Raster) Data format that stems from a Lidar point cloud. The DEM raster provides height (Z) information from a section of a gravel-cobble bed river in South-East Germany, which constitutes the baseline for the computational grids featured in the next sections. To get the provided DEM in the QGIS project:
Download the example DEM GeoTIFF and save it in the same folder (
/Project Home/or a sub-directory) as the above-create qgz project.Add the downloaded DEM as a new raster layer in QGIS:
In QGIS’ Browser panel find the Project Home directory where you downloaded the DEM tif.
Drag the DEM tif from the Project Home folder into QGIS’ Layer panel.
To facilitate delineating specific regions of the river ecosystem later, add a satellite imagery basemap (XYZ tile) under the DEM and customize the layer symbology.
What are QGIS panels again?
Learn more in the QGIS tutorial on Panels, Toolbars, and Plugins.
The DEM should now be displayed on the map (if not: right-click on the DEM layer and click on Zoom to Layer(s) in the context menu) as shown in Fig. 73.
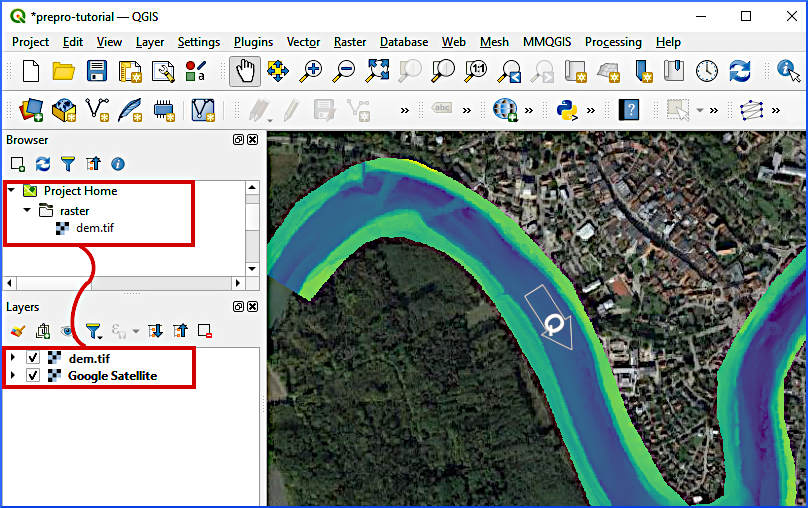
Fig. 73 The imported DEM on a Google Satellite imagery basemap (source: Google / GeoBasis-DEBKG 2019). The flow direction is from left to right following the Q arrow.#
Create 2dm Mesh#
The generation of a SMS 2dm uses the QGIS BASEmesh plugin and requires drawing a
Line Shapefile containing model boundaries and internal breaklines between model regions with different characteristics (section on Model Boundary and Breaklines);
Line Shapefile containing model boundaries for assigning inflow and outflow conditions (section on Liquid (Hydraulic) Boundaries); and a
Point Shapefile containing markers for the definition of characteristics of model regions (section on Region Markers).
These shapefiles enable to generate a Quality Mesh. Ultimately, height information is interpolated to the quality mesh and the resulting mesh is saved as SMS 2dm file. The next sections walk through the procedure step by step with detailed explanations. Additional materials and intermediate data products are provided in the supplemental data repository (materials-bm) for this tutorial.
Model Boundary and Breaklines#
The model boundary defines the model extent and can be divided into regions with different characteristics (e.g., roughness values) through breaklines. Breaklines indicate, for instance, channel banks and the riverbed (main channel), and need to be inside the DEM extents. Boundary lines and breaklines are stored in a Line Shapefile that BASEmesh uses to find both model boundaries and internal breaklines between model regions. For this purpose, Create a Line Shapefile with one Text Field called LineType and call it breaklines.shp (Layer > Create Layer > New Shapefile Layer). Click on QGIS’ Layers menu > Create Layer > New Shapefile Layer… (see Fig. 74). Make sure to select ESRI: 31494 - Germany_Zone_4 as CRS  .
.
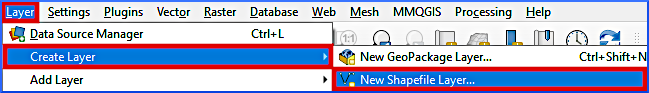
Fig. 74 Create a new shapefile from QGIS’ Layers menu.#
It is important that the lines do not overlap to avoid ambiguous or missing definitions of regions and to ensure that all boundary lines form closed regions (areas). Therefore, activate snapping:
Activate the Snapping Toolbar: View > Toolbars > Snapping Toolbar
In the Snapping toolbar > Enable Snapping

Enable snapping for
Vertex, Segment, and Middle of Segments
 .
.Snapping on Intersections
 .
.
Next, start to edit breaklines.shp by clicking on the yellow pen  and draw the lines indicated in Fig. 75 by activating Add Line Feature
  .
.
Boundaries of the model at the left and the right floodplain limits:
Delineate the outer bounds of the floodplains.
Make sure that all points and lines are inside the DEM layer.
Do not cross the river (wetted area indicated by the satellite imagery basemap).
Finalize every line with a right-click.
For the LineType field use text values such as boundary left/right floodplain.
Refer to the red lines in Fig. 75.
Breaklines of the left bank (LB) and right bank (RB):
Draw lines along the wetted main channel indicated in the satellite imagery basemap.
Make sure that line ends perfectly coincide with the before-created floodplain boundary lines (this is where snapping helps); thus, the main channel’s hard breaklines and the floodplain boundary lines need to enclose the floodplains without any gap between the lines.
For the LineType field use text values such as hardline LB/RB.
Refer to the yellow-orange lines in Fig. 75 (note the delineation of the small tributaries in the top left at the left bank and in the bottom right at the right bank).
Breaklines of gravel banks:
Draw lines along the gravel banks that are visible in the satellite imagery basemap in the main channel.
Make sure that the line ends perfectly coincide with the before-created main channel breaklines (hardlines); thus, the main channel’s hard breaklines and the gravel bank breaklines need to enclose the gravel banks without any gap between the lines.
For the LineType field use text values such as hardline gravel bank.
Refer to the green-ish lines in Fig. 75.
Optional: Breaklines of block ramps:
Find the rough block ramps (effervescing waters) in the satellite imagery basemap and delineate them by drawing lines across the wetted main channel.
Make sure that the line ends perfectly coincide with the main channel breaklines; thus, the main channel’s hard breaklines and the block ramp breaklines need to enclose the block ramps without any gap between the lines.
For the LineType field use text values such as hardline sss (or anything else - the example refers to the German word Schüttsteinschwelle).
Refer to the blue lines in Fig. 75.
Optional: Breakline of a sandbank:
Find the sandbank deposit in the upper left corner in Fig. 75 on the satellite imagery basemap and delineate it by drawing a smoothly curved line.
Make sure that the line ends perfectly coincide with the main channel breaklines and embrace a closed area without any gap between the lines.
For the LineType field use text values such as hardline sand.
Refer to the purple line in the upper left corner in Fig. 75.
To correct drawing errors use the Vertex Tool  . Finally, save the new lines (edits of breaklines.shp) by clicking on the Save Layer Edits
  symbol. Stop (Toggle) Editing by clicking again on the yellow pen symbol.
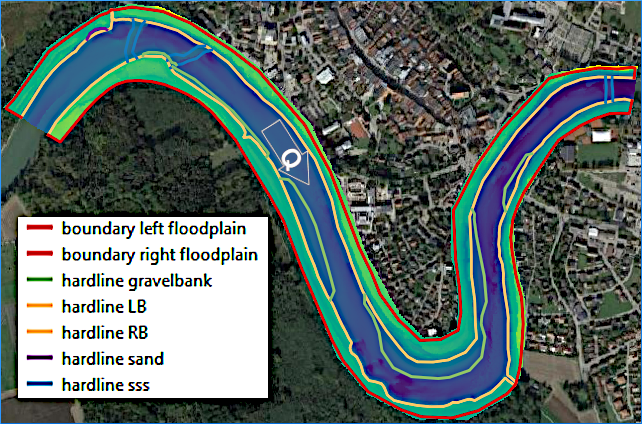
Fig. 75 Boundary and breaklines to draw in breaklines.shp. Left and right banks and floodplains are orientated in the flow direction (Q arrow).#
Troubles with drawing boundaries and breaklines?
Download the zipped breaklines shapefile shown in the above figure and unpack it into the project folder, for instance, /Project Home/shapefiles/breaklines.[SHP].
The default layer style is Single Symbol. For better representation, double-click on the breaklines layer, go to the Symbology tab and select Categorized (or Graduated) instead of Single Symbol (at the very top of the Layer Properties window). In the Value field, select LineType, then click the classify button on the bottom of the Layer Properties window. The listbox will now show the LineType values.
Draw boundaries of complex DEMs…
Drawing boundaries manually around large DEMs can be very time consuming, in particular, if the raw data are a point cloud and not yet converted to a Gridded Cell (Raster) Data.
If you are dealing with a point cloud, consider using QGIS Convex Hull tool that draws a tight bounding polygon around points.
If you are dealing with a large GeoTIFF, consider using QGIS’ Raster to Vector tool.
Liquid (Hydraulic) Boundaries#
The liquid boundaries define where hydraulic conditions, such as a given discharge or stage-discharge relationship, apply at the model inflow (upstream) and outflow (downstream) limits. Thus, a functional river model requires at least one inflow boundary (line) where mass flow into the model and one outflow boundary (line) where mass fluxes leave the model. For this purpose, Create a Line Shapefile called liquid-boundaries.shp and define two text data fields named type and stringdef. Make sure that snapping is still enabled (as above explained in the Model Boundary and Breaklines section) and Toggle (Start) Editing the new liquid-boundaries.shp. Then draw two lines:
Activate Add Line Feature
.Draw an inflow boundary line (see also Fig. 76):
Zoom to the inflow region of the DEM limits, where there is a gap between the above-created floodplain boundary breaklines.
Start drawing a line on the left bank (left side of the below figure) and moved Eastwards (i.e., to the right) to make seven more points across the river.
The seventh point needs to coincide with the end of the right bank’s floodplain boundary breakline.
Thus, the upstream flow is coming from the right-hand side of the inflow boundary line (i.e., the upstream flow direction will be
rightfor the numerical model).Finalize the line with a right-click, and enter
Inflowin the type field andinflowin the stringdef field (the case matters).To correct drawing errors use the Vertex Tool
.
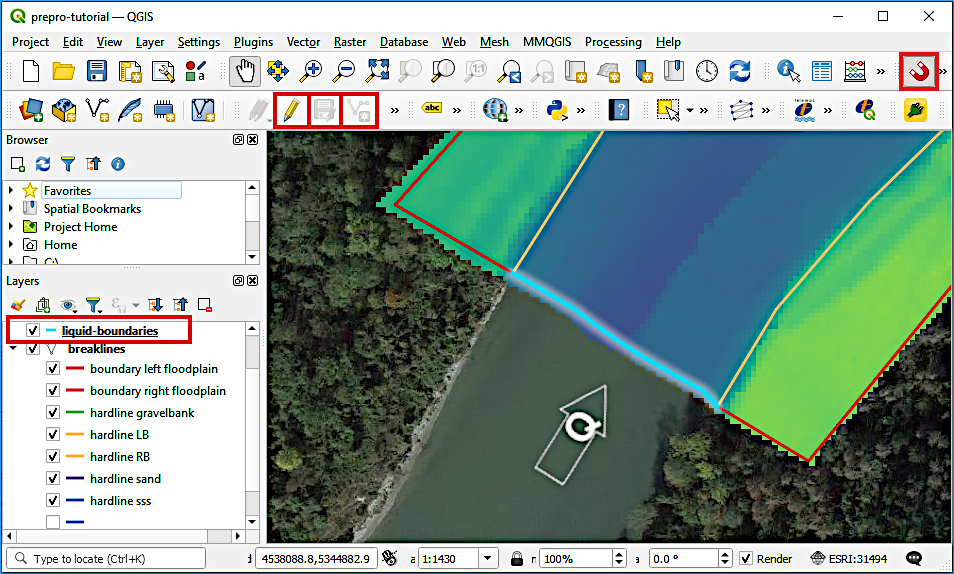
Fig. 76 The inflow boundary line is drawn from the left to the right (i.e., the upstream flow is coming from the right-hand side of the inflow boundary line). The sequence of buttons to use is highlighted by the red boxes.#
Next, draw an outflow boundary line (see also Fig. 77):
Zoom to the outflow region of the DEM limits, where there is a gap between the above-created floodplain boundary breaklines.
Start drawing a line on the left bank (top of the below figure) and move Southwestwards (i.e., to the bottom) to make seven more points across the river.
The seventh point needs to coincide with the end of the right bank’s floodplain boundary breakline.
Thus, the upstream flow is coming from the right-hand side of the outflow boundary line (i.e., the upstream flow direction will be
rightfor the numerical model).Finalize the line with a right-click, and enter
Outflowin the type field andoutflowin the stringdef field (the case matters).To correct drawing errors use the Vertex Tool
.
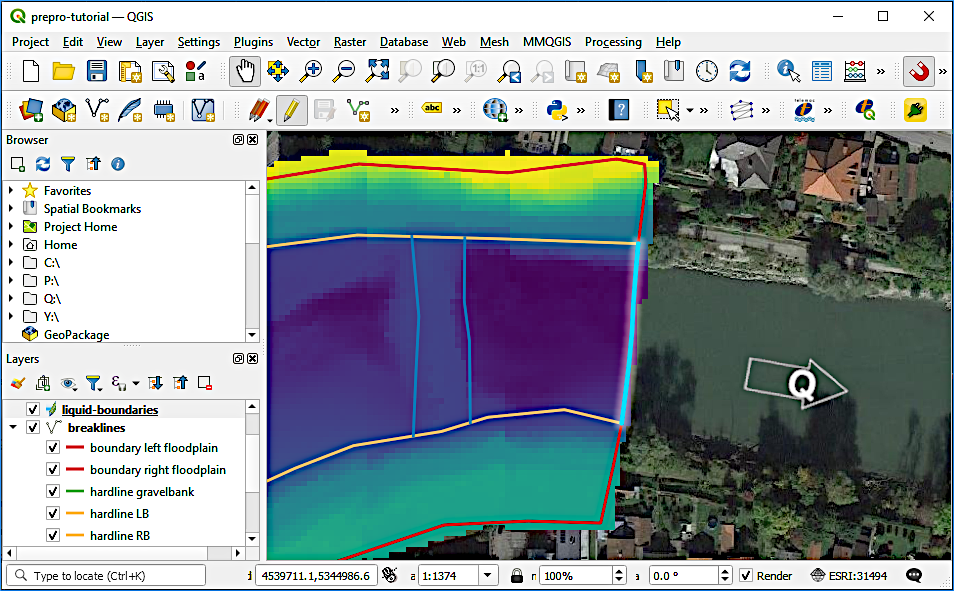
Fig. 77 The outflow boundary line is drawn from the top to the bottom (i.e., the upstream flow is coming from the right hand-side of the outflow boundary line).#
Constraints of inflow and outflow boundaries
The inflow and outflow boundary lines must have the same number of nodes (here 7 plus 1) and no liquid boundary line may have more than 40 nodes.
Finally, save the liquid boundary lines (edits of liquid-boundaries.shp) by clicking on the Save Layer Edits symbol. Stop (Toggle) Editing by clicking again on the yellow pen symbol.
Troubles with drawing the liquid boundary lines?
Download the zipped liquid-boundaries shapefile and unpack it into the project folder, for instance, /Project Home/shapefiles/liquid-boundaries.[SHP].
stringdefs
The stringdefs field values can be directly used with BASEMENT, where hydraulic data (e.g., discharge, water depth, or stage-discharge relations) can be assigned to the here defined georeferenced inflow and outflow boundary lines.
Region Markers#
Region markers are placed inside regions defined by boundary lines and breaklines. Every region marker (i.e., a point somewhere in the region area) assigns, for instance, a material identifier (MATIDs) and a maximum mesh cell area. The latter option enables to define small mesh cells (mesh areas) in the active channel bed and can larger cell areas in the floodplain regions. Create a Point Shapefile named raster-points.shp with the following definitions (see also Fig. 78):
Define the File name as region-points.shp (or similar)
Ensure the Geometry type is Point
The CRS
corresponds to Germany Zone 4 (see project CRS)Add three New Fields (in addition to the default Integer type ID field):
max_area = Decimal number (length = 10, precision = 3)
MATID = Whole number (length = 3)
type = Text data (length = 20)
Click OK to create the new point shapefile.
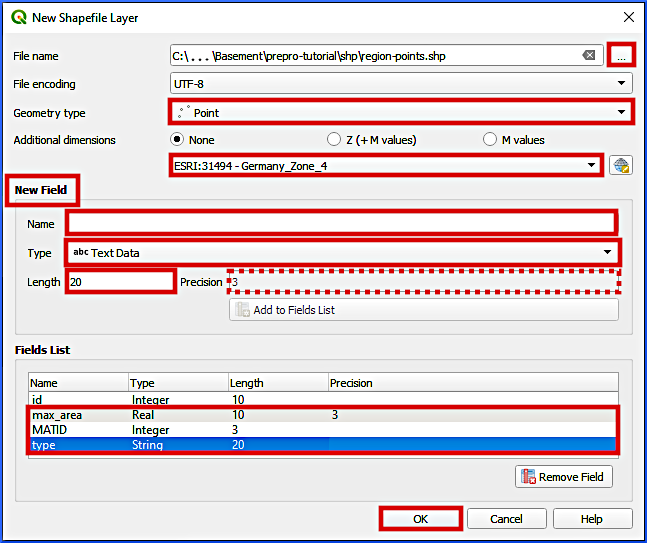
Fig. 78 Definitions and fields to be added to the region-points shapefile.#
Consider to deactivate snapping for drawing the region markers to avoid that region markers coincide with any line. Then, Toggle (Start) Editing the new region-points.shp file and activate Add Point Feature  . Draw one point in every area section that is enclosed by breaklines and (liquid) boundary lines. Depending on the apparent area type from the satellite imagery basemap, assign one of the five regions listed in Tab. 4 to every point.
Region |
Riverbed |
Block ramps |
Gravel banks |
Floodplains |
Sand |
|---|---|---|---|---|---|
max_area |
25.0 |
20.0 |
25.0 |
80.0 |
20.0 |
MATID |
1 |
2 |
3 |
4 |
5 |
type |
riverbed |
block_ramp |
gravel_bank |
floodplain |
sand_deposit |
After drawing a point in every closed area, save the region point markers (edits of region-points.shp) by clicking on the Save Layer Edits symbol. Stop (Toggle) Editing by clicking again on the yellow pen symbol. Figure 79 shows an example for region marker points within the areas delineated by the breaklines.
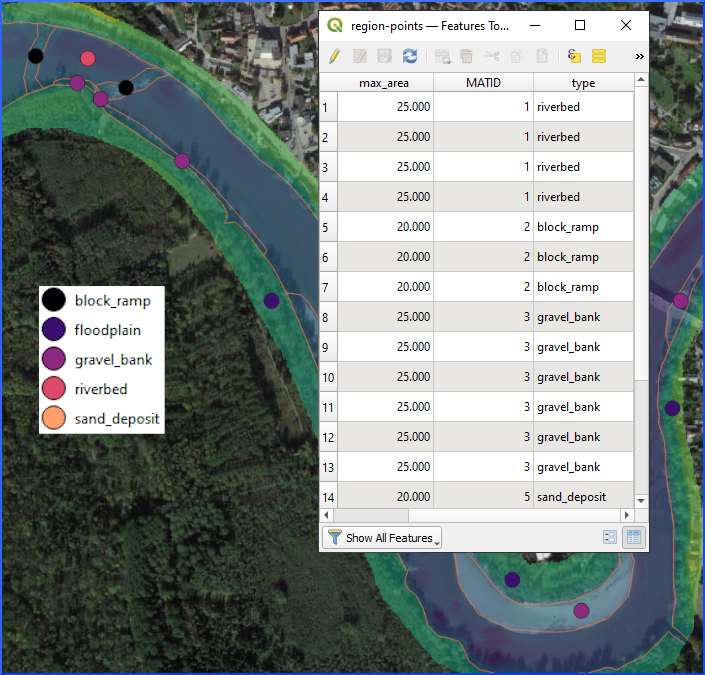
Fig. 79 Example for region point markers in the project boundaries.#
Troubles with drawing the region marker points?
Download the zipped region-points shapefile and unpack it into the project folder, for instance, /Project Home/shapefiles/region-points.[SHP].
Create a Quality Mesh#
BASEmesh’s quality mesh tool creates a computationally efficient triangular mesh based on Shewchuk [She96] and within the above-defined model boundaries. The tool associates mesh properties with the regions shapefile ([see above section on Region Markers), but it does not include elevation data. Thus, after generating a quality mesh, elevation information needs to be added. This section explains the quality mesh generation and the next section features the interpolation of bottom elevations.
In QGIS’ Plugins menu, click on BASEmesh 2 > QUALITY MESHING to open the quality mesh tool. Make the following settings in the popup window (see also Fig. 80):
Triangulation constraints frame:
Breaklines = breaklines (see Model Boundary and Breaklines).
Keep all other defaults.
Regions frame:
Activate the Regions checkbox.
Region marker layer = regions-points (see Region Markers).
Activate the MATID field checkbox and select the regions-points shapefile’s MATID field.
Activate the Maximum area field checkbox and select the regions-points shapefile’s max_area field.
Mesh domain frame: keep defaults.
String definitions frame:
Activate the String definitions checkbox.
String definitions layer = liquid boundaries.
String definitions ID field = stringdef.
Activate the Include in 2DM node strings (BASEMENT 3) checkbox.
Ignore all BASEMENT 2.8 options.
Settings frame: keep defaults.
Output frame:
Click on the Browse… button and define a 2dm file name in the
/Project Home/directory, such as prepro-tutorial_quality-mesh.2dm.
Click on the Run button to create the quality mesh.
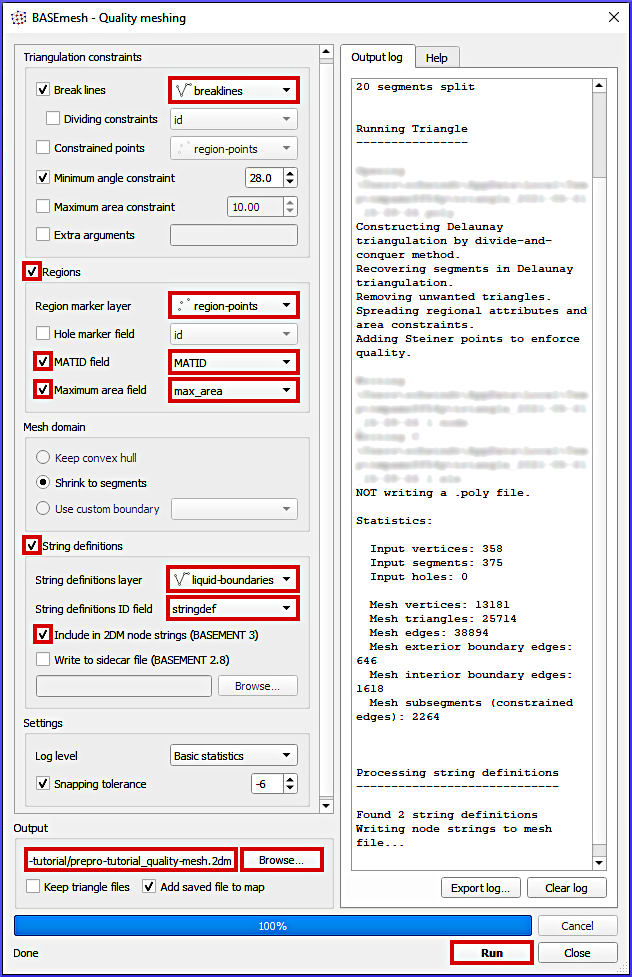
Fig. 80 Definitions to be made in BASEmesh’s Quality meshing tool.#
Quality meshing may take time. After a successful mesh generation the file prepro-tutorial_quality-mesh-interp.2dm will have been generated.
Interpolate Bottom Elevation to Quality Mesh#
The BASEmesh plugin’s Interpolation tool projects bottom elevation data onto the quality mesh by interpolation from another mesh or a DEM Gridded Cell (Raster) Data. Here, we use the above-introduced DEM GeoTIFF. To run the interpolation, open BASEmesh’s Interpolation tool (QGIS Plugins menu > BASEmesh 2 > Interpolation) and make the following settings (see also Fig. 81):
In the Mesh layer to interpolate frame, select prepro-tutorial_quality-mesh.
In the Basic tab find the Elevation source frame and activate the Activation via DEM (Raster) radio button.
Select dem.tif GeoTIFF (see Load DEM section) as Raster layer.
In the Output frame click on the Browse button to define an output mesh name in the
/Project Home/directory, for example, prepro-tutorial_quality-mesh-interp.2dmClick Run to create the height-interpolated mesh.
Error with BASEmesh v2.0.9 - Interpolation via DEM not working
Since BASEmesh v2.0.9, the Interpolation window does not detect any Raster layer (nothing can be selected from the dropdown menu). A functional work-around is to convert the DEM raster into a mesh file:
Convert the DEM into a point shapefile (raster to vector) and make sure the point’s attribute table is filled with elevations.
Use the TIN Mesh Creation tool to generate a TIN elevation mesh with elevation data.
In BASEmesh’s Interpolation tool, select the option Interpolation via elevation Mesh and select the TIN elevation mesh created before.
Click Run to continue with the tutorial.
To find the above-mentioned conversion tools, go to QGIS Processing top menu > Toolbox and enter the tool names in the search… field.
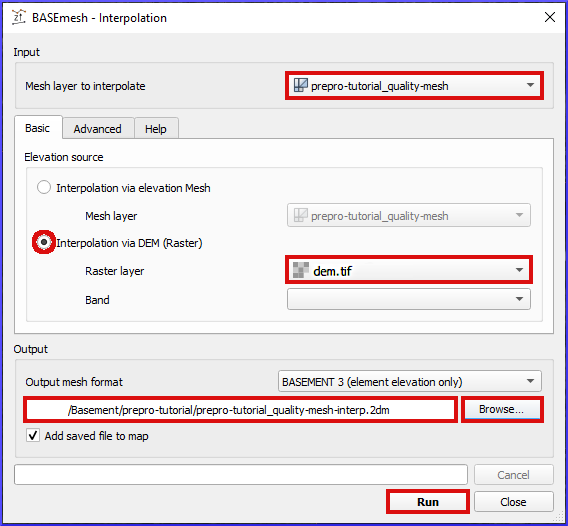
Fig. 81 BASEmesh’s Z-value (height) interpolation tool and setup to assign bottom elevation values to the quality mesh.#
After the elevation interpolation, verify that the elevations are correctly assigned (i.e., the Bed Elevation should have taken values between 367 and 387 m a.s.l.). To modify the layer visualization (symbology) double-click on the new prepro-tutorial_quality-mesh-interp and go to the Symbology ribbon. Select Graduated at the very top of the window, set the Value to Z, Method to COLOR, choose a color ramp, and click on the classify bottom (lower part of the window). Click on Apply and OK to close the symbology settings. Figure 82 shows an example visualization of the height-interpolated mesh.
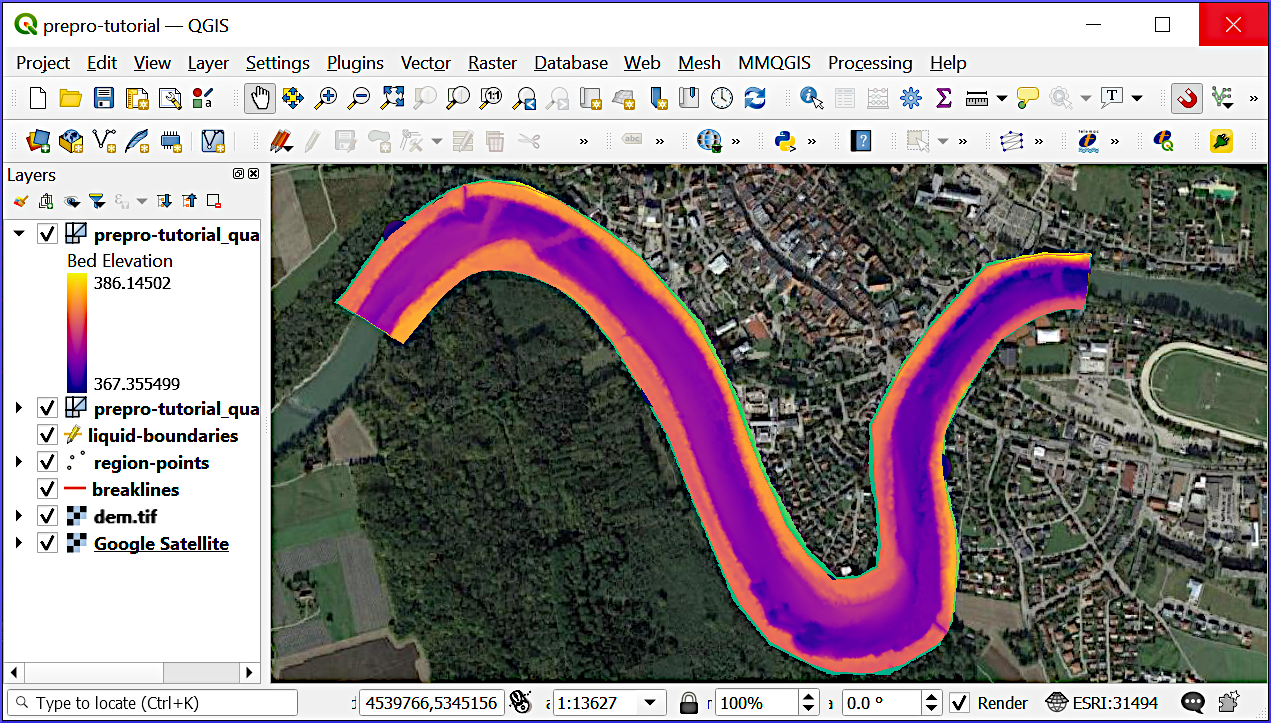
Fig. 82 Verify elevation interpolation using graduated color ramps.#
Usage with BASEMENT#
The 2dm mesh file produced in this tutorial can be directly used with BASEMENT, where only the definition of properties of the geometric (e.g., roughness coefficients) and liquid (e.g., discharges) are required as explained later.