Run this notebook in your web browser: 
The link opens b10-xml.py as an interactive marimo notebook that runs entirely in your web browser, without installing anything.
Wait a moment until Python has loaded in the browser (this takes longer only at the first start).
Click the yellow run button (▶︎, bottom right) to run all cells.
Edit and re-run any code cell to experiment: marimo automatically updates all cells that depend on it.
Your edits remain in the browser tab only. To keep them, save the notebook through the menu (☰, top right) > Export… > Python.
Run this marimo notebook locally
To run b10-xml.py on your own machine, get it from the marimo
Clone the repository:
git clone https://github.com/sschwindt/marimo-python-course.gitCreate and activate the course environment:
conda env create -f environment.ymlandconda activate hy-marimoIn the repository folder, start the notebook with
marimo edit b10-xml.py
Run this notebook with Jupyter
This page is also available as the Jupyter notebook b10-xml.ipynb in the jupyter , or install Python and JupyterLab locally to run b10-xml.ipynb on your own machine.
Create, manipulate, and copy semi-structured data files in the form of xlsx-workbooks and JSON files: This chapter starts with background information about XML and what XML has to do with workbooks, and JSON: XML is an abbreviation for Extensible Markup Language that defines rules for encoding documents. XML is a text-based markup language for representing document structure and data. An XLSX workbook is an Office Open XML package: it is normally stored as a ZIP archive containing XML parts and other resources. Applications such as spreadsheet programs interpret those parts and present the workbook to users. HTML has its own syntax and parsing rules, although HTML can also be serialized with XML syntax. Other structured file formats like JSON (JavaScript Object Notation) is a separate text format that can represent structured data with objects, arrays, strings, numbers, Boolean values, and null.
Dealng with structured data is important in water resources engineering, where in practice, we are often interested in the exchange of information with managers who prefer office workbooks (.xlsx files). Also, JSON files can efficiently store numerical models setups (e.g., for BASEMENT).
Watch this section as a video
Watch this section as a video on the @Hydro-Morphodynamics channel on YouTube.
Workbook (xlsx) Handling
Why do we want to communicate with workbooks at all? We have already seen that Python is much more powerful than office programs for the systematic analysis of data. However, Python requires the abstraction of data in our minds to visualize, for example, the structure of a nested list. For this reason, data from and for marketing, your boss, or public authorities are often required to have visually easy-to-use workbook formats, which can be overlooked quickly. Still, we want to leverage the content of such workbook information efficiently with Python and we want to produce visually simplistic output that anyone can read without any Python knowledge.
We have already seen that pandas provides easy routines for importing and exporting data from and to workbooks, respectively (cf. file reading and writing with pandas). pandas primarily uses openpyxl depending on what is available in the active Python environment. openpyxl is one of the most powerful options for handling workbooks with Python (note: this assertion is subjective) and this section introduces openpyxl.
This introduction uses the following workbook-related terms:
workbook is the main xlsx file we work with (also called spreadsheet);
sheet is the tabular content of a workbook and one workbook can have multiple sheets;
columns are vertical lines in a sheet;
rows are horizontal lines in a sheet;
cells are elements of a sheet.
Create a Workbook
openpyxl has a Workbook class that enables to create and fill workbooks with data. Typically, an instance of the Workbook class is called wb, and worksheet variables are called ws.
import numpy as np
import openpyxl as oxl


wb = oxl.Workbook()  # create a Workbook instance
ws = wb.active  # activate worksheet
ws.title = "Gaussian 2D"  # name worksheet
ws["A1"] = "Gaussian sample data"  # write to cell A1

# generate some data
x, y = np.meshgrid(np.linspace(-1, 1, 20), np.linspace(-1, 1, 20))
dis = np.sqrt(x * x + y * y)
sigma, mu = 1.0, 0.0
gaussian = np.exp(-((dis - mu) ** 2 / (2.0 * sigma ** 2)))

# write data to worksheet
m, n = gaussian.shape
for i in range(1, m + 1):
  for j in range(1, n + 1):
	  ws.cell(row=i + 1, column=j, value=gaussian[i - 1, j - 1])

print("Workbook data in cell A2: "+ str(ws["A2"].value))
print("Corresponds to np.array value: " + str(gaussian[0, 0]))

# save and close (destruct object) workbook
wb.save(filename="data/python_workbook.xlsx")
wb.close()
Workbook data in cell A2: 0.3678794411714422
Corresponds to np.array value: 0.3678794411714422
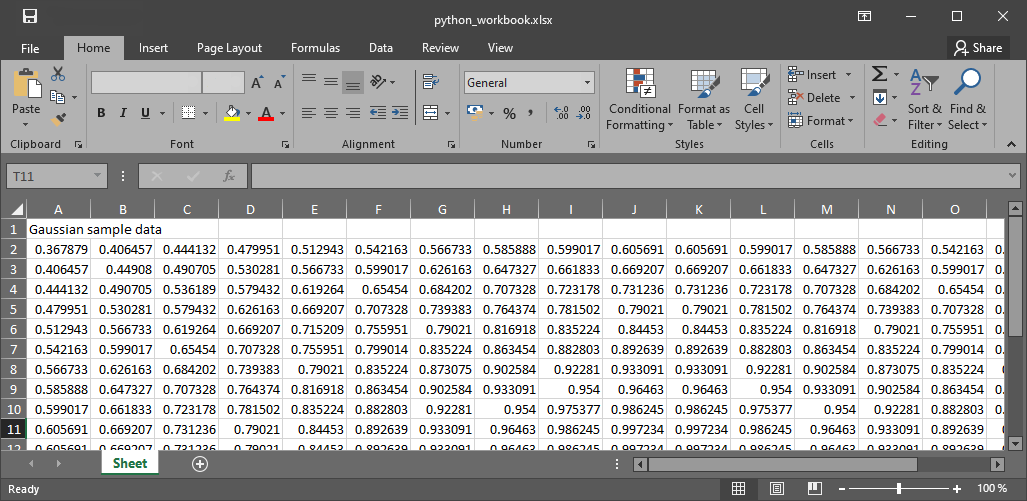
Figure 1:The resulting workbook.
Read and Manipulate an Existing Workbook
openpyxl.load_workbook(...) accepts options including:
read_only=Truefor a memory-efficient, read-only view of an existing workbook;data_only=Falseto expose formula text, ordata_only=Trueto expose the cached value last stored by a spreadsheet application;keep_vba=Trueto preserve VBA content without making it editable.
Write-only mode applies when creating a new workbook: openpyxl.Workbook(write_only=True).
If read_only=False, we can manipulate cell values and also cell formats, including data formats (e.g., date, time, and many more), font properties (and many more cell styles), or colors in HEX Color Code (find your favorite color here). The following example opens the above-created python_workbook.xlsx, adds a new worksheet, illustrates the implementation of cell styles, and fills the workbook with random discharge measurements.
import datetime
from openpyxl.styles import Font, Alignment, PatternFill
wb = oxl.load_workbook(filename="data/python_workbook.xlsx", read_only=False)
ws = wb.create_sheet(title="Discharge")

# define title styles
title_font = Font(name="Tahoma", size="11", bold=True, italic=True, color="C1D0DE")
title_fill = PatternFill(fill_type="solid", start_color="050505", end_color="073AD4")
title_align = Alignment(horizontal='center', vertical='bottom', text_rotation=0,
                        wrap_text=False, shrink_to_fit=False, indent=0)

date_time_format = "yyyy-mm-dd hh:mm:ss"
ws["A1"] = "Date-Time (%s)" % date_time_format

title_cell_flow = ws["B1"]
title_cell_flow.value = "Discharge (CMS)"
title_cell_flow.font = title_font
title_cell_flow.fill = title_fill
title_cell_flow.alignment = title_align

# define time period and time delta of 1 hour = 3600 seconds
current_date_time = datetime.datetime(2040, 12, 24, 0, 0)
dt = datetime.timedelta(seconds=3600)

# write random discharges to workbooks
for row in ws.iter_rows(min_row=2, max_row=26, min_col=1, max_col=2):
    row[0].value = current_date_time
    row[0].number_format = date_time_format
    row[1].value = np.random.random_sample(size=None) * 100
    row[1].number_format = "0.00"
    current_date_time += dt

wb.save("data/python_workbook_reloaded.xlsx")
wb.close()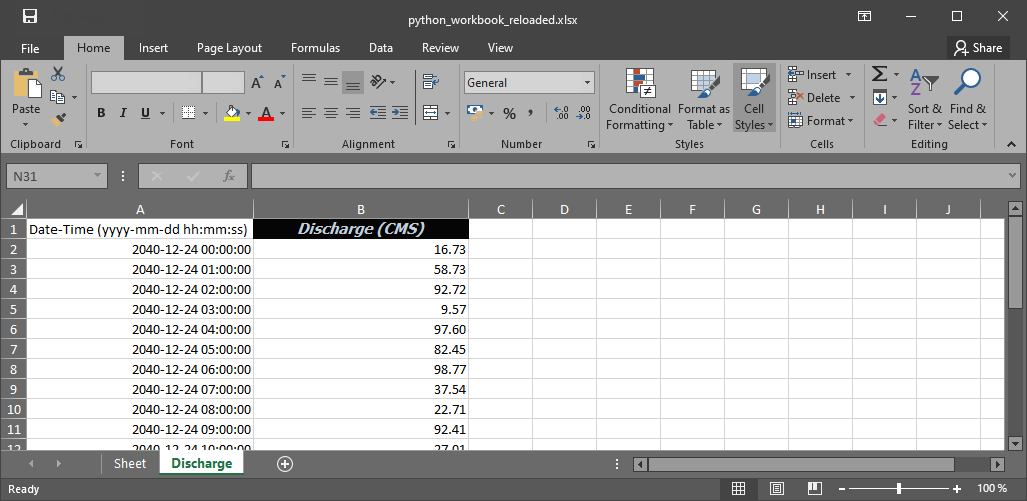
Figure 2:The updated workbook.
The below code block provides the short helper function read_columns to read only one or more columns into a (nested) list (reads until the maximum number of rows, defined by ws.rows, in a workbook is reached). A similar function can be written for reading rows.
def read_columns(ws, start_row=1, columns="ABC"):
  """Return one list per requested worksheet column."""
  return [
	  [ws[f"{column}{row}"].value
	   for row in range(start_row, ws.max_row + 1)]
	  for column in columns
  ]


# example usage:
wb = oxl.load_workbook(filename="data/python_workbook.xlsx", read_only=False)
ws = wb.active
col_D = read_columns(ws, start_row=2, columns="D")
col_F = read_columns(ws, start_row=2, columns="F")
wb.close()
Challenge: Add a random test set to modified-data-wb.xlsx
The pandas file handling section features the creation of a workbook containing 4 columns of test data (download modified-data-wb.xlsx). For a random-test comparison, you want to add a column of random values. To this end:
Open modified-data-wb.xlsx with openpyxl
wb = oxl.load_workbook(filename="data/modified-data-wb.xlsx", read_only=False)Get the active worksheet
ws = wb.activeAdd a new column name in column F:
ws["F1"].value = "Random values"Create a list (i.e., a 1d array) of random numbers with numpy (do not forget to
import numpy as np)rnd_data = np.random.random(18)Iterate over the random data array and write the values to the workbook’s F column
Start the iteration with
for row, val in enumerate(rnd_data):In every iteration add the next random value of
rnd_datawithws["F" + str(row + 2)].value = val
Note the usage ofrow + 2(one header column and different absolutes of Python and the workbook)
Save and close the workbook
wb.save(os.getcwd() + "/data/re-modified-data-wb.xlsx"(do not forget toimport os)wb.close()Alternatively, use a namespace for the workbook manipulation!
Formulae in Workbooks
openpyxl can read and write formula strings, but it does not calculate them. With data_only=False, a formula cell exposes its formula text. With data_only=True, it exposes the cached result last stored by a spreadsheet application, which may be missing or stale. Membership in openpyxl.utils.FORMULAE can be informative, but it does not evaluate or validate a formula. However, not all workbook formulae are recognized by openpyxl and in the case of doubts, a dirty try-and-error approach is the only remedy. As an example, change SQRT in the below example to the formula in question. However, not all workbook formulae are recognized by openpyxl and in the case of doubts, a dirty try-and-error approach is the only remedy. As an example, change SQRT in the below example to the formula in question.
from openpyxl.utils import FORMULAE
print("SQRT" in FORMULAE)
True
(Un)merge Cells
Merging and un-merging cells is a popular office function for style purposes and openpyxl also provides functions to perform merge operations:
ws.merge_cells(start_row=1, end_row=3, start_column=1, end_column=2)
ws.unmerge_cells(start_row=1, end_row=3, start_column=1, end_column=2)
Charts (Plots)
In the unlikely event that you want to insert plots directly into workbooks with Python (matplotlib is more powerful anyway), openpyxl provides features for this purpose as well. To illustrate the creation of an area chart, the below code block re-uses the first column of random values in the above-created python_workbook.xlsx.
from openpyxl.chart import AreaChart, Reference, Series

wb = oxl.load_workbook(filename="data/python_workbook.xlsx", read_only=False)
ws = wb.active

chart = AreaChart()
chart.title = "Random Gaussian"
chart.style = 10
chart.x_axis.title = "Cell row"
chart.y_axis.title = "Random value (-)"

col_D = Reference(ws, min_col=4, min_row=2, max_row=20)
col_F = Reference(ws, min_col=6, min_row=2, max_row=20)

chart.add_data(col_F, titles_from_data=False)
chart.add_data(col_D, titles_from_data=False)

ws.add_chart(chart, "B2")

wb.save("data/python_workbook_chart.xlsx")
wb.close()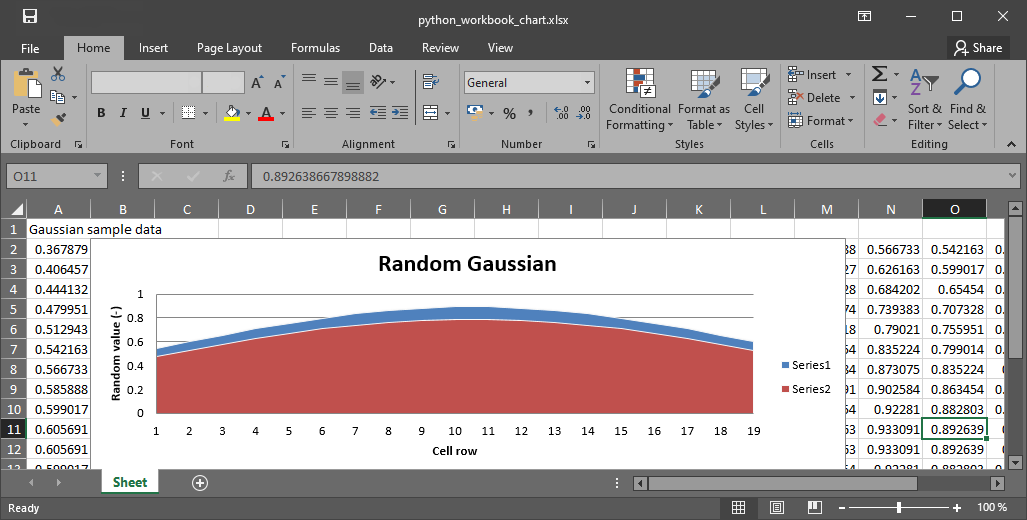
Figure 3:The workbook with the plot created in Python.
Other workbook charts are available and their implementation (still: why would you?) is explained in the openpyxl docs.
Customize Workbook Manipulation
There are many ways of modifying workbooks and openpyxl provides close-to “shovel-ready” methods to manipulate a workbook. Still, to avoid re-reading this lesson every time you want to manipulate a workbook, it is more convenient to have your own workbook manipulation classes ready to work. To this end, the following code block defines custom Read and Write classes, where Read is the parent class of the Write class (recall the section on inheritance of classes). The Read class may contain tailored functions for reading specific columns, rows, or arrays. The below code block also makes use of the above-defined read_columns function, implemented as a method of the Read class.
import openpyxl as oxl


class Read:
  def __init__(self, workbook_name, *, read_only=False,
			   data_only=False, sheet_name=None):
	  self.wb = oxl.load_workbook(
		  filename=workbook_name,
		  read_only=read_only,
		  data_only=data_only,
	  )
	  self.ws = self.wb[sheet_name] if sheet_name else self.wb.active

  def read_columns(self, start_row=1, columns="ABC"):
	  return [
		  self.ws[f"{column}{row}"].value
		  for row in range(start_row, self.ws.max_row + 1)
		  for column in columns
	  ]


  def __call__(self):
	  print(dir(self))


class Write(Read):
  def __init__(self, workbook_name, *, data_only=False,
			   sheet_name=None):
	  super().__init__(
		  workbook_name,
		  read_only=False,
		  data_only=data_only,
		  sheet_name=sheet_name,
	  )
An extended example script with more complex Read and Write classes can be downloaded from the course repository.
An Example from Water Resources Engineering and Research
The ecological restoration or enhancement of rivers requires, among other data, information on preferred water depths and flow velocities of target fish species. This information is established by biologists and then often provided in the shape of so-called habitat suitability index (HSI) curves in workbook formats. Typically, we produce geospatially explicit data on water depth and flow velocity with numerical models. The output of two or three-dimensional numerical models is way too large to be handled with office applications. So we need an advanced tool, such as Python, to handle the geospatially explicit data, and read and interpolate HSI curves from workbooks. What does that look like technically? The exercises on geospatial Python will let you dive into aquatic habitat (assessments).
JSON
JavaScript Object Notation (JSON) files have a similar structure to XML and enable the structured storage of (human-readable) data. For instance, the numerical code BASEMENT v.3.x (read more in the numerical modeling chapter) uses a model.json and a simulation.json file to store model setup parameters such as material properties. Thus, automating numerical model setups with Python involves the modification of model parameters stored in json files. This is where Python steps in with the standard-library json module that encodes and decodes JSON. JSON values can be objects, arrays, strings, numbers, true, false, or null. An object contains string names paired with values, for example {"name": "Vanilla Flow"}. An array is an ordered sequence of values, for example [1, 3, 7, 31].
JSON File Structure
A JSON file consists of two types of data structures, which are dictionary objects and arrays in the form of lists of values. The dictionary objects in a JSON file correspond to the same format that we already know in Python: Pairs of keys (names) and values embraced by curly brackets (braces) {"name": value}. The value can be a string, numeric, a comma-separated list [] (array) of data, or another dictionary.
The following example shows a JSON file called river_struct.json with a RIVER key that has a nested dictionary as a value. The value-dictionary contains three keys (NAME, GEOMETRY, and HYDRAULICS).
{
	"RIVER": {
		"NAME": "Vanilla Flow",
		"GEOMETRY": {
			"REGIONS": [
				{
				  "type": "wet",
				  "name": "riverbed"
				},
				{
				  "type": "dry",
				  "name": "floodplain"
				}
			],
			"FLOWBOUNDARIES": [
				{
				  "name": "Inflow",
				  "nodes": [1, 3, 7, 31]
				},
				{
				  "name": "Outflow",
				  "nodes": [89, 90, 76, 69, 95]
				}
			]
		},
		"HYDRAULICS": {
			"BOUNDARY": [
				{
					"discharge_file": "/simulation/directory/Inflow.txt",
					"name": "Inflow",
					"slope": 0.005,
					"type": "hydrograph"
				},
				{
					"name": "Outflow",
					"type": "zero_gradient"
				}
			],
			"FRICTION": {
				"cobble": 20.0,
				"gravel": 26.0,
				"sand": 41
			}
		},
		"LOCATION": [48.744079, 9.103928]
	}
}
{'RIVER': {'NAME': 'Vanilla Flow',
'GEOMETRY': {'REGIONS': [{'type': 'wet', 'name': 'riverbed'},
{'type': 'dry', 'name': 'floodplain'}],
'FLOWBOUNDARIES': [{'name': 'Inflow', 'nodes': [1, 3, 7, 31]},
{'name': 'Outflow', 'nodes': [89, 90, 76, 69, 95]}]},
'HYDRAULICS': {'BOUNDARY': [{'discharge_file': '/simulation/directory/Inflow.txt',
'name': 'Inflow',
'slope': 0.005,
'type': 'hydrograph'},
{'name': 'Outflow', 'type': 'zero_gradient'}],
'FRICTION': {'cobble': 20.0, 'gravel': 26.0, 'sand': 41}},
'LOCATION': [48.744079, 9.103928]}}Read (Decode) and Write (Encode) JSON Files with the json Library
JSON files can be implemented in many programming languages, including HTML and Python. Python has a built-in json library that enables JSON decoding and encoding. The json library provides a json.dumps(DATA) method to “dump” (i.e., encode) data in JSON format. Vice versa, the json.load() function reads data from JSON files.
The following example illustrates encoding and decoding an arbitrarily nested dataset with the json library.
import json
# create arbitrary nested data (list, dictionary, tuple)
data_for_json = [
  "list_element1",
  {"dict_key": ("tuple_element", "text", 1.0, None)},
]

# create a json file
json_file = open("data/my-first.json", mode="w+")
# encode the random nested data list in json format and write to file
json_file.write(json.dumps(data_for_json))
# close file
json_file.close()

# re-open the json file to read data
with open("data/my-first.json", mode="r") as re_opened_file:
    raw_data = re_opened_file.readline()

# decode json data in a Python variable
data_from_json = json.loads(raw_data)
print(json.dumps(data_from_json))
["list_element1", {"dict_key": ["tuple_element", "text", 1.0, null]}]
The Python docs provide more options and descriptions on using the json library. However, here we will (once again) make use of the pandas library, which offers powerful features for handling json data.
Read (Decode) and Write (Encode) JSON Files with pandas
pandas (recall data and file handling with pandas) enables reading JSON files into its convenient table format with an embedded usage of the json library. The following code block uses the pandasRIVER sample file (download river_struct.json).
import pandas as pd
river = pd.read_json("data/river_struct.json")
print(river)
RIVER
NAME Vanilla Flow
GEOMETRY {'REGIONS': [{'type': 'wet', 'name': 'riverbed...
HYDRAULICS {'BOUNDARY': [{'discharge_file': '/simulation/...
LOCATION [48.744079, 9.103928]
Since a river without data is like ice cream without taste, we will add (random) data on flow characteristics to the data structure. Let’s assume that we have used the data from river_struct.json to simulate a stationary discharge in a two-dimensional numerical model. As a result, we have two regular grids (arrays) with data on flow velocity and water depth. Now, we want to append both the flow velocity and water depth arrays in the form of a result structure (dictionary) to river_struct.json and give the river a new name.
# create random data
import numpy as np
h = np.random.weibull(np.arange(0,100)).reshape(10, 10)
u = np.random.weibull(np.arange(0,100)).reshape(10, 10)

# append RESULTS row to pandas dataframe
river_dict = river.to_dict()
river_dict["RIVER"].update({"RESULTS": {"water_depth": h, "flow_velocity": u}})
updated_river = pd.DataFrame.from_dict(river_dict)

# re-NAME RIVER
updated_river.loc["NAME", "RIVER"] = "Honey river"
print(updated_river)

# export to JSON
updated_river.to_json("data/river_results.json")
RIVER
NAME Honey river
GEOMETRY {'REGIONS': [{'type': 'wet', 'name': 'riverbed...
HYDRAULICS {'BOUNDARY': [{'discharge_file': '/simulation/...
LOCATION [48.744079, 9.103928]
RESULTS {'water_depth': [[0.0, 1.4016850027236283, 0.6...
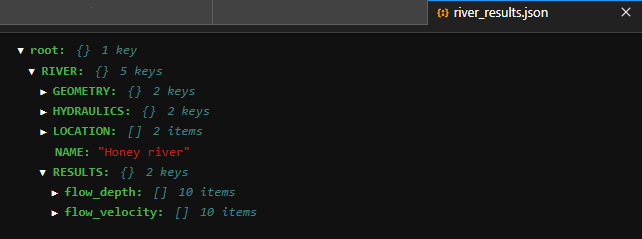
Figure 4:The resulting workbook.