Post-processing is a crucial step in understanding and analyzing the results of CFD simulations, particularly for multiphase flow scenarios. This tutorial is designed to guide you through the essential steps of extracting meaningful insights from OpenFOAM simulations, emphasizing the visualization and analysis with ParaView (ParaFoam). On this page, you will learn how to efficiently use tools like ParaView to interpret simulation outcomes, manipulate and process OpenFOAM outputs.
Retrieve simulation data
In the case in which the simulations were run in parallel, before post-processing the data, the first step consists in reconstructing (i.e., reassembling) all solution steps of the analyzed case. This can either be done for all time steps or only for a specific one. The commands that need to be typed in the terminal window are shown below:
To reconstruct all solution steps:
user@user123:~/OpenFOAM-9/channel/Simulation$ reconstructParTo reconstruct a specific time step (substitute “x” with the time step):
user@user123:~/OpenFOAM-9/channel/Simulation$ reconstructPar -time xVisualization with ParaView (paraFoam)
ParaFoam is a customized version of the ParaView visualization software that comes pre-configured to read and process OpenFOAM simulation data directly. It simplifies post-processing by integrating OpenFOAM-specific file formats and functionalities, allowing users to visualize fields, extract insights, and analyze results without additional setup.
Working with paraFoam requires that the simulation case has been constructed (see above section). A simulation case refers to the complete set of files and configurations required to define, run, and analyze a specific simulation scenario. It includes the geometry and mesh of the computational domain, initial and boundary conditions, solver settings, physical models, and any additional parameters necessary for the simulation. The case is organized into directories such as constant (material properties and mesh), system (solver controls), and 0 (initial conditions), forming a structured framework for numerical experiments.
Launch paraFoam
Once the case has been reconstructed, as for the meshing process, the following command can be used to visualize the case in the software ParaView:
user@user123:~/OpenFOAM-9/channel/Simulation$ paraFoamVisualization pipelines
The channel.OpenFOAM should now be present in the Pipeline Browser and to visualize it in the layout, press the Apply button. Additionally, in the Fields section, the various fields that can be visualized are shown and can be selected/deselected according to the focus of the analysis.
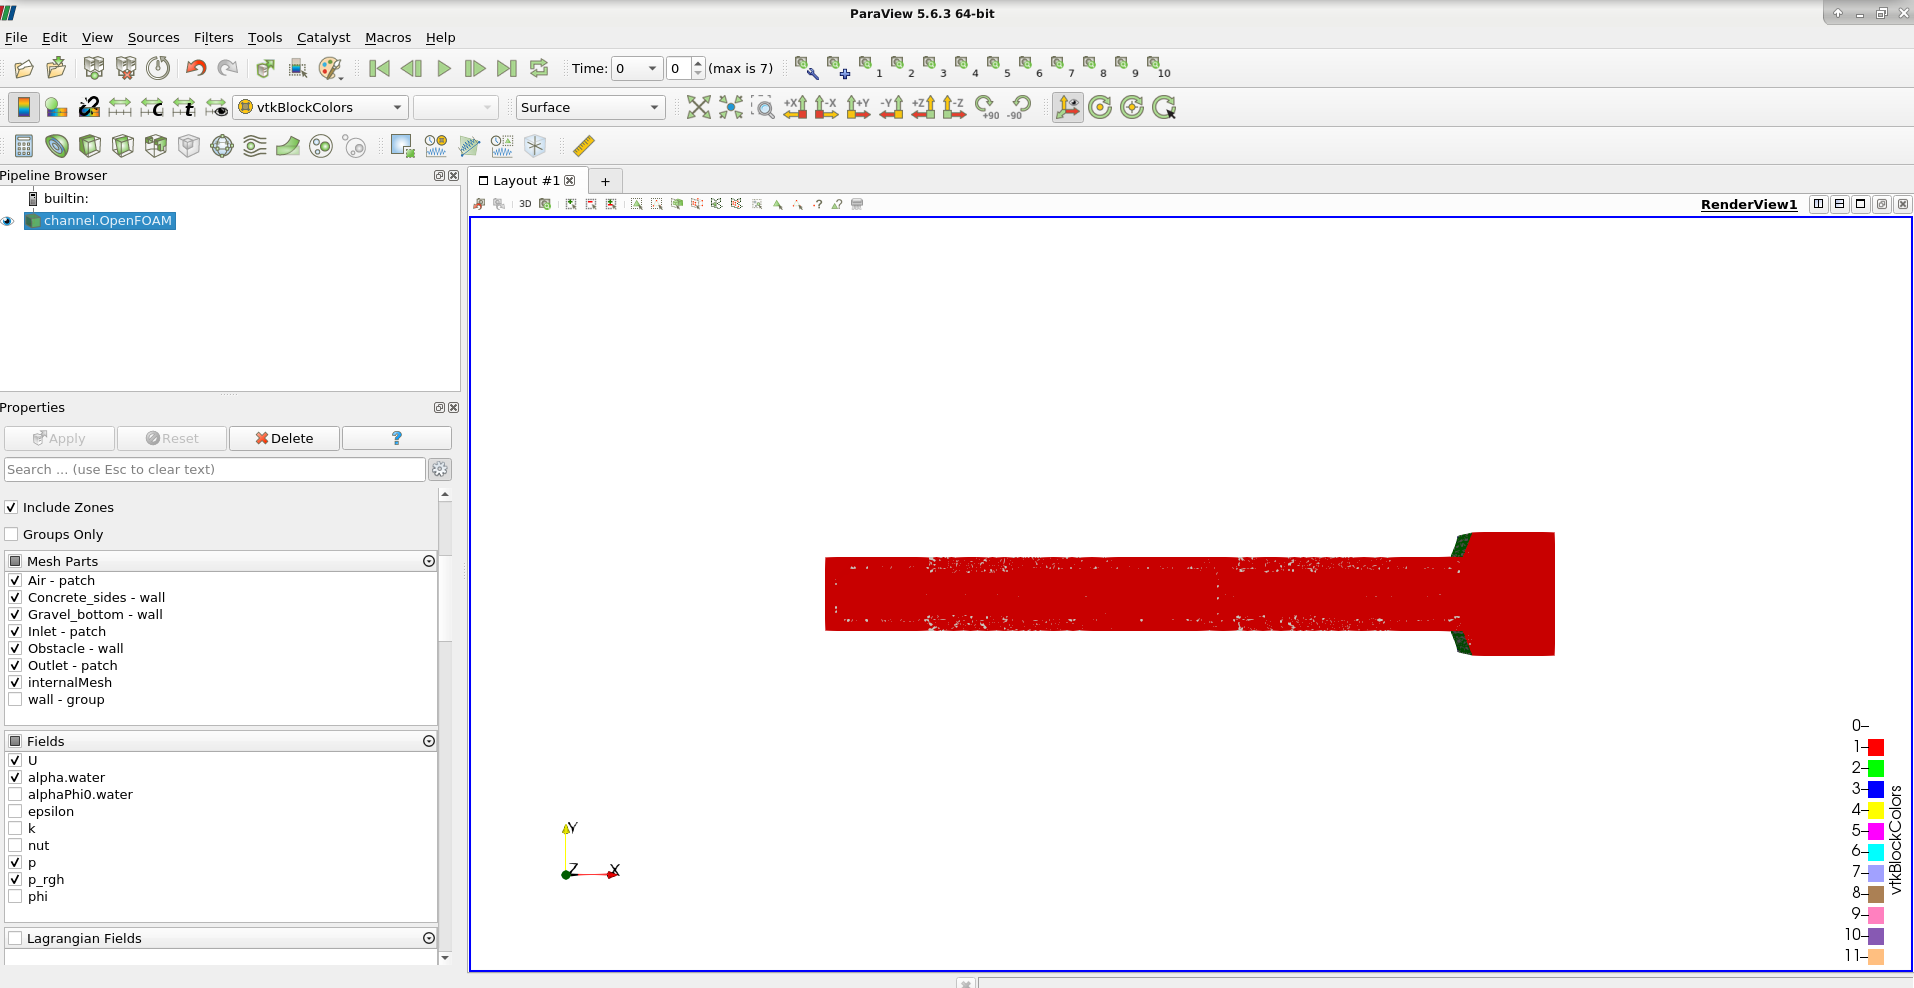
Figure 1:Visualization of the case results in ParaView.
In order to visualize the air and water phases, alpha.water should then be selected in the drop-down menu as shown in the image below.
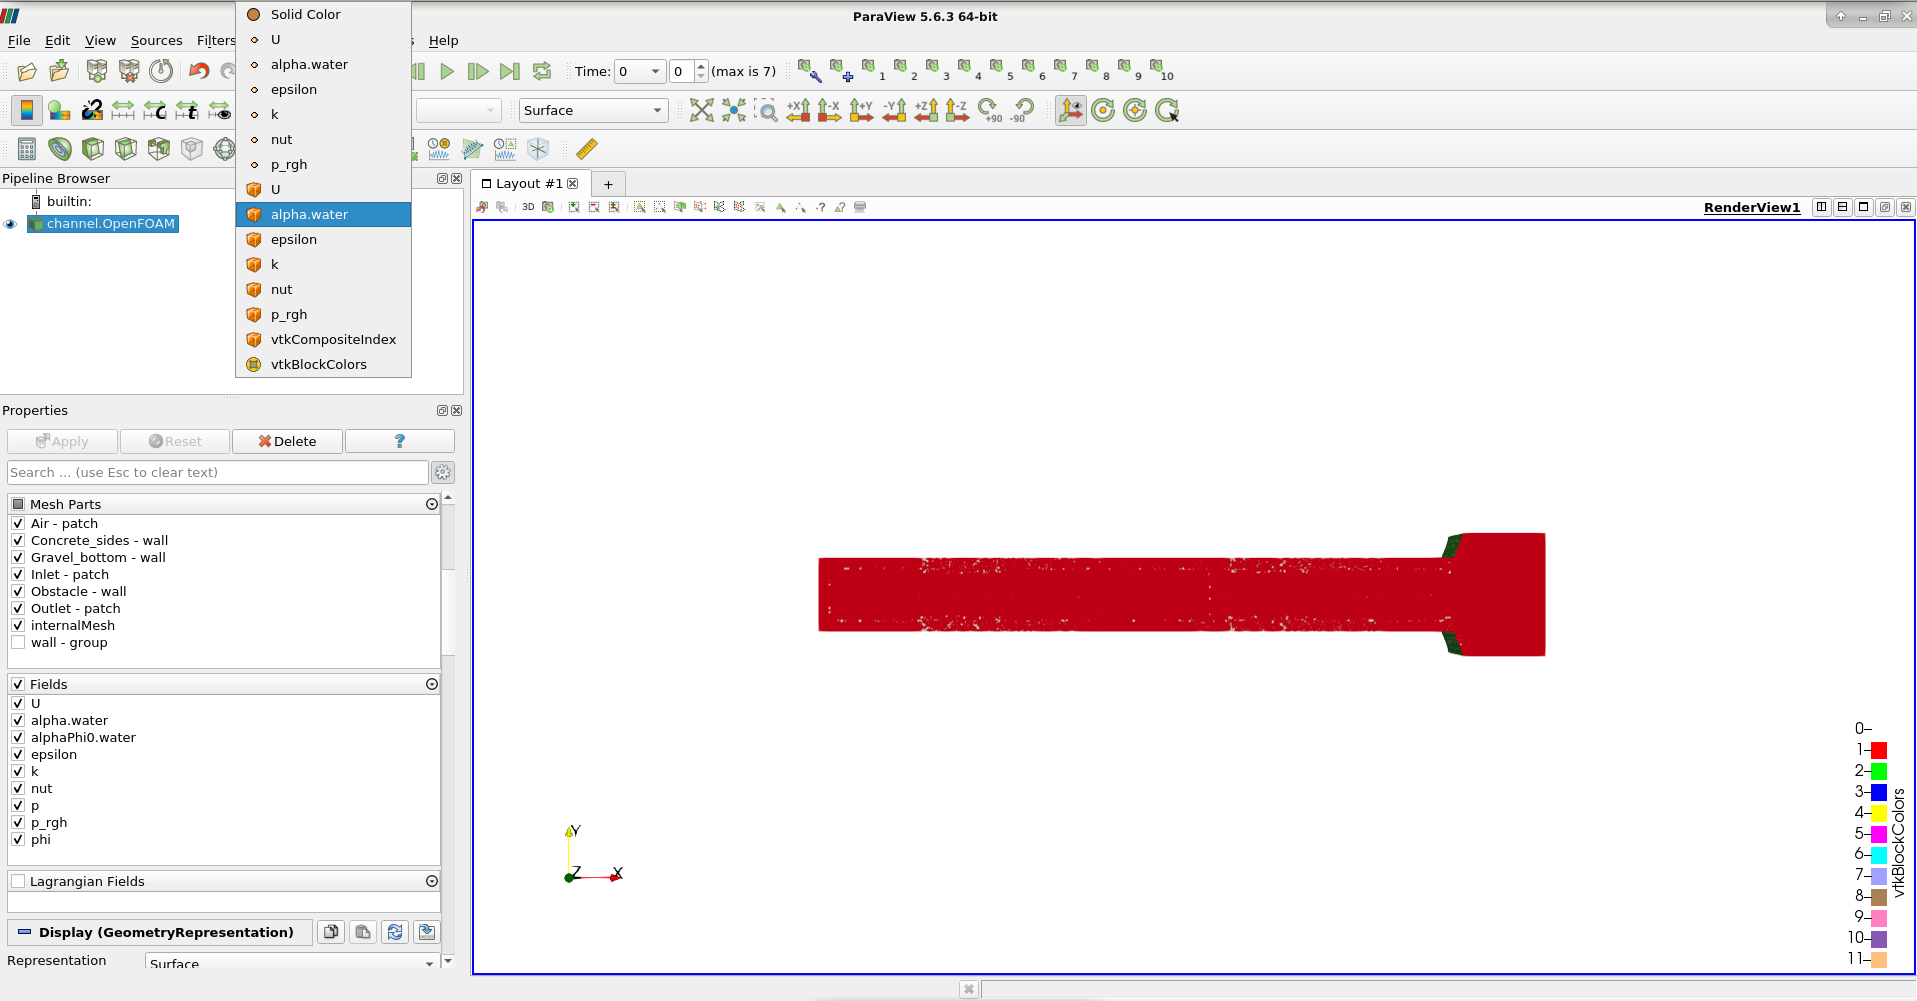
Figure 2:Enabling the setting for viewing the air and water phases in ParaView.
To change the shown time step, the arrows that can be seen in the area highlighted in red can be used.
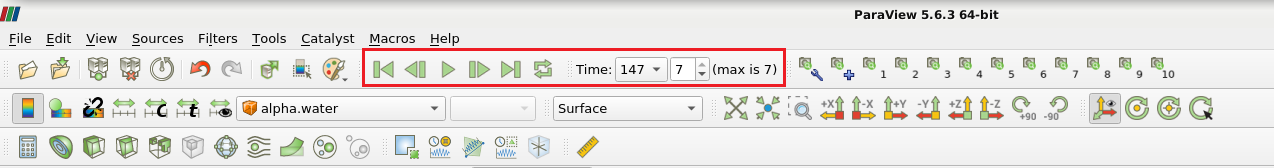
Figure 3:Options for changing the time step to be visualized.
Next, to visualize only the water phase, the Clip filter is used. This can either be found in the Filters section in the menu, or alternatively, the shortcut can be used. The Clip Type should be set to Scalar, selecting alpha.water as scalar and setting the value to 0.5, which represents the interface between air and water. To view the air phase, the Invert option should be selected whereas for the water phase it should be deselected.
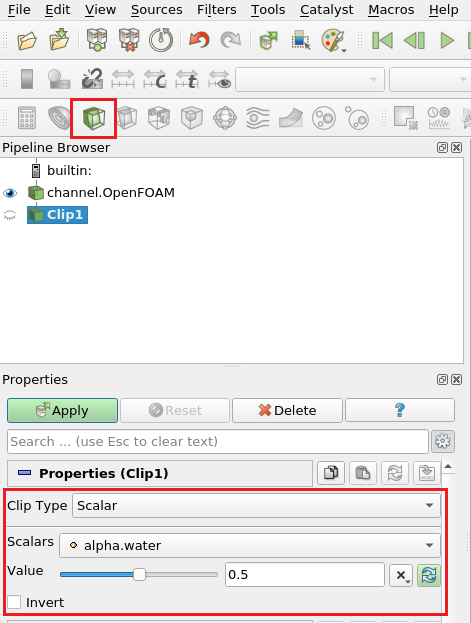
Figure 4:Clip filter used for viewing the water phase in ParaView.
Finally, to also add the walls and patches to the view, the Extract Block filter can be implemented (click on the channel.OpenFOAM file before applying it).
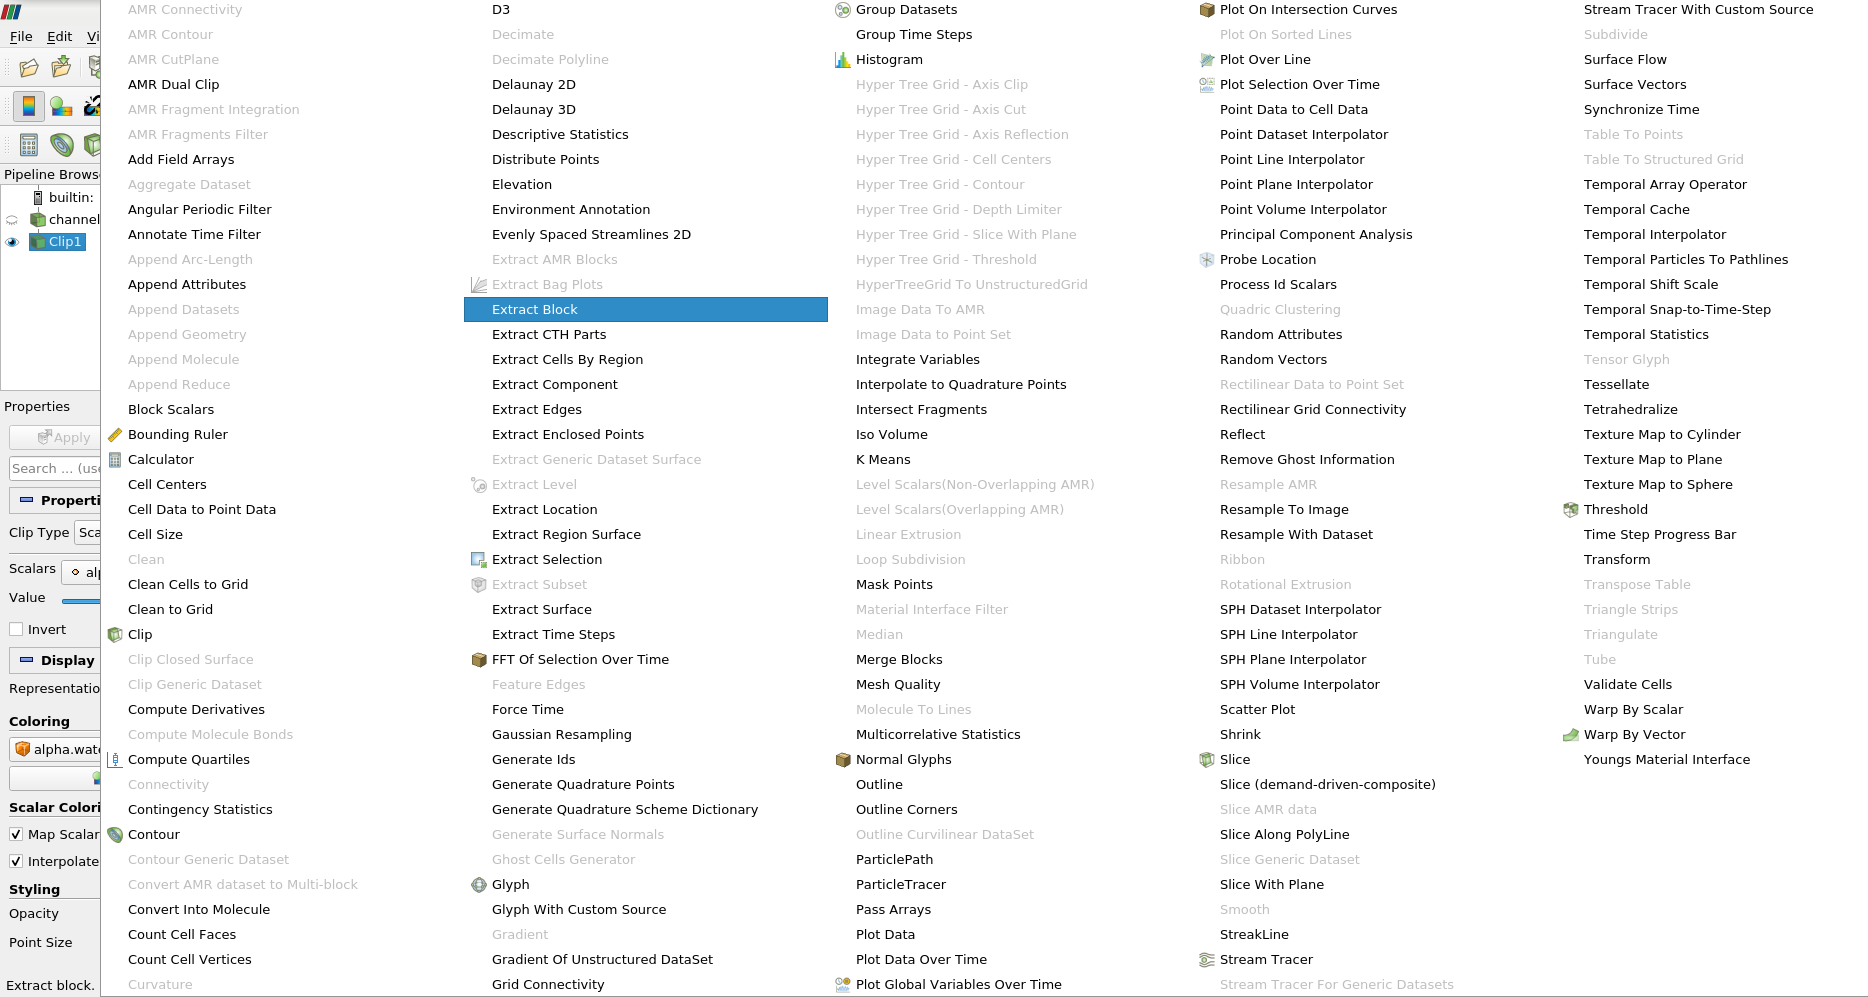
Figure 5:List of filters available in ParaView, highlighting ExtractBlock.
The patches of interest can then be either selected or deselected, and the Coloring can be set to Solid Color.
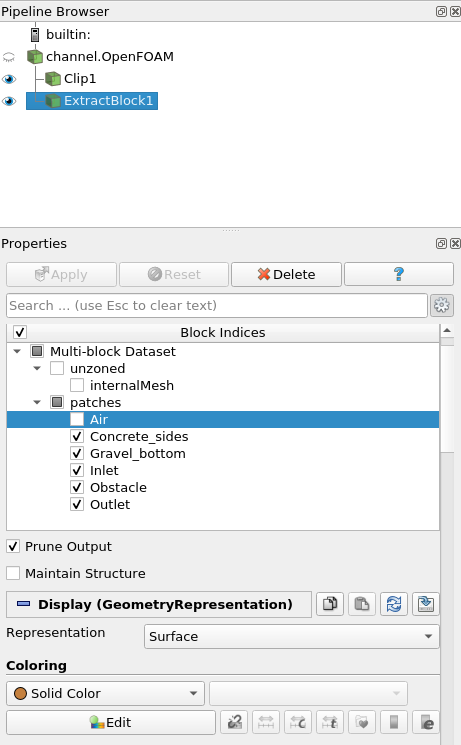
Figure 6:Available options for selecting the patches and changing the color.
The resulting view of the water phase and block extraction is shown below:
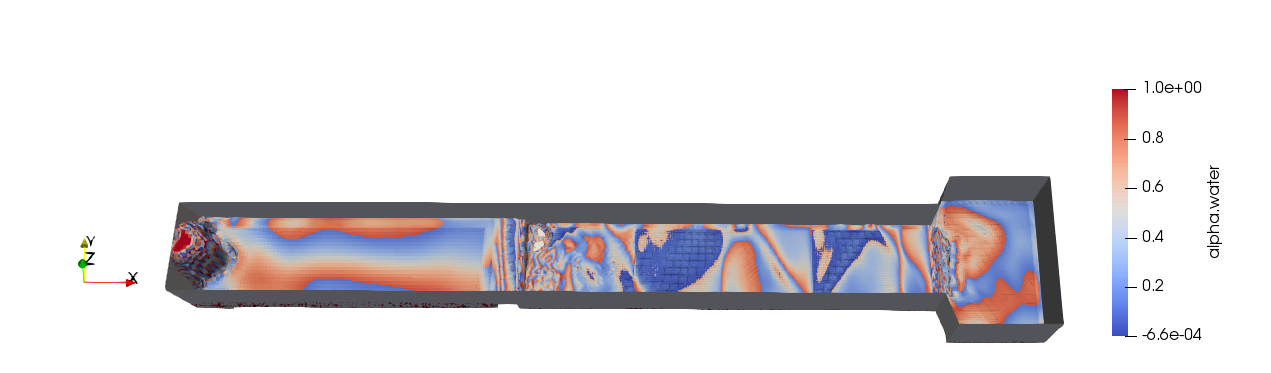
Figure 7:Simulation results highlighting the water phase.
Different parameters can also be viewed, such as the flow velocity, and this can be done in the Coloring section by selecting U. The preset can be modified to better view the results by selecting the corresponding icon (highlighted in green).
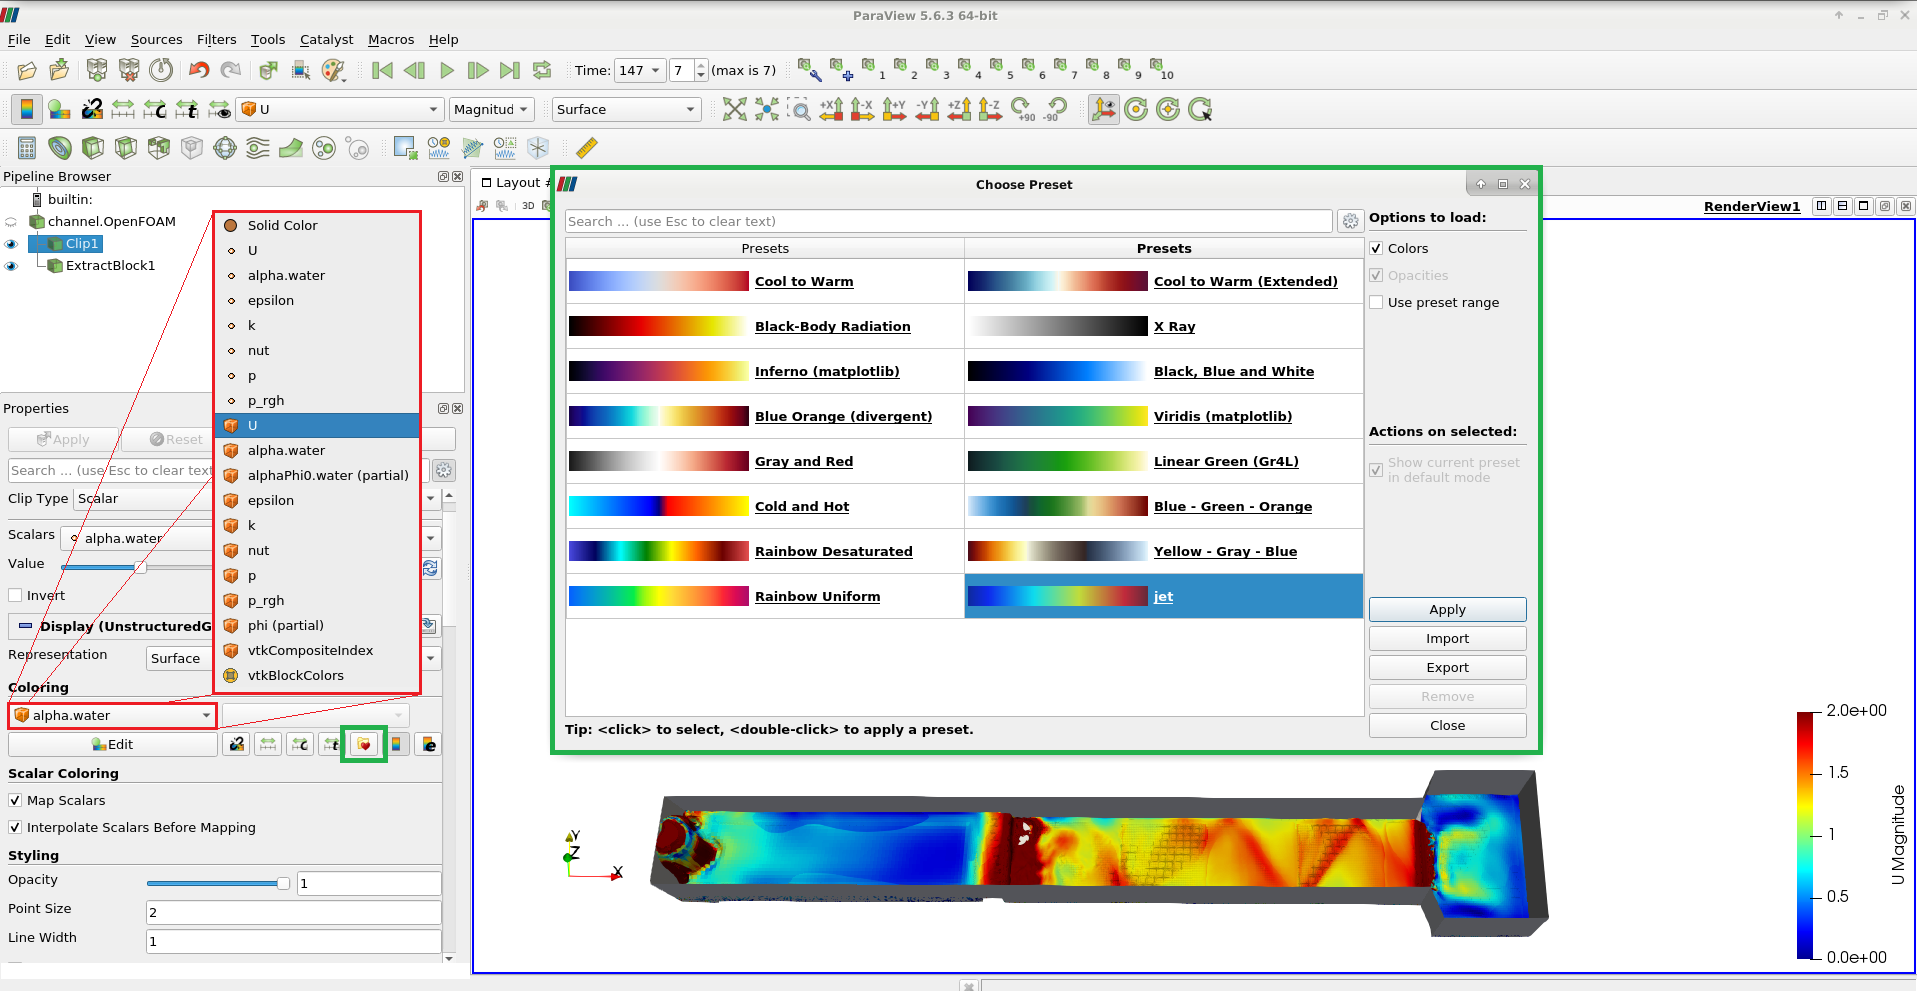
Figure 8:Simulation results highlighting the flow velocity.